Map of stable and unstable nuclei
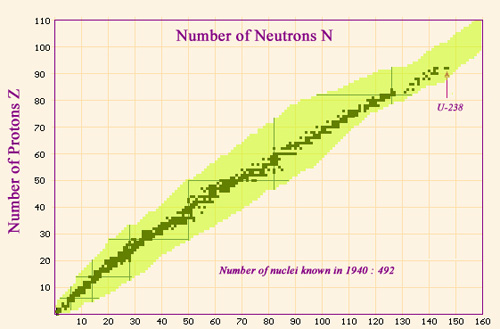
Nuclei map in 1940
Map showing the nuclei known before 1940. The stable or quasi-stable nuclei follow a line which stretches along the bottom of the valley of stability. The line ends at the heaviest natural nucleus, uranium 238 a radioactive isotope made of 92 protons and 146 neutrons. The area in yellow represents the nuclei known today, which are far greater in number but are unstable.
© NUCLEUS
The progress made in our understanding of the subatomic world over the past decades has allowed us to classify 287 types of ‘natural’ (i.e. stable or quasi-stable) nuclei and over 2,500 radioactive nuclei. Some of these radioisotopes have such short half-lives that they barely have the time to acquire orbiting electrons and be classified as atoms. Experts often arrange all these nuclei on a map of number of constituent protons versus the number of constituent neutrons. This nucleus graph is an important part of the nuclear physics Bible.
Just as geographical maps indicate the relative heights of different points, the nuclear map provides information about the degree of stability the nucleus possesses. This degree of stability is measured by the binding energy of the nucleons within the nucleus.
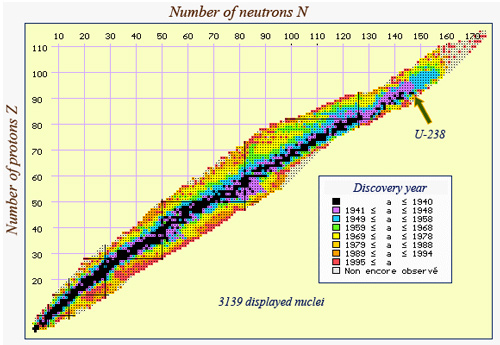
Today nuclei map
The nuclei known today have been coloured according to the period of discovery. The unstable nuclei can be found on both sides of the stability valley as well as in its extension tbeyond U-238. It is in this area of heavy nuclei that one finds the ‘transuranic’ elements – those that have more than 92 protons and are therefore heavier than uranium.
© IN2P3
The average mass of one nucleon in a nucleus – which can be directly linked to this binding energy – can be compared to ‘altitude levels’ on an geographic map. The stable or quasi-stable nuclei can then all be found in a region at the heart of the map – an area known as the bottom of the stability valley. The valley stretches from light nuclei, which have approximately equal numbers of protons and neutrons, to heavy nuclei, which have a slight neutron excess.
Located at the far end of the valley, bismuth 209 is the heaviest stable nucleus with its 83 protons and 126 neutrons. Beyond that point, we find unstable nuclei, heavier structures which decay to form lighter nuclei. These decay processes can be very slow, however, and unstable nuclei can persist for millennia in the Earth’s crust. Thorium 232, uranium 235 and uranium 238 are examples of radioisotopes that have not yet completely disappeared. Uranium 238 is, in fact, the heaviest natural nucleus with 92 protons and 136 neutrons.
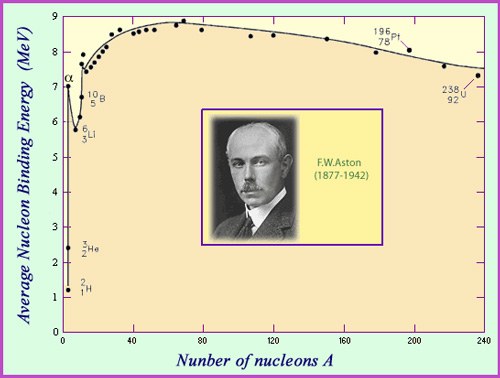
The Aston Curve
The binding energy per nucleon represents the average energy needed to rip one nucleon away from a nucleus. It is a measure of nuclear stability. The curve of binding energy represented as a function of the number of nucleons is known as the Aston Curve – a tribute to the English physicist F.W. Aston. Aston was one of the first scientists to measure the mass of different nuclei, work that earned him the 1922 Nobel prize. One of the important observations that can be made using Aston’s curve is that around 8 MeV are needed in average to remove a nucleon from a nucleus, with the binding energy per nucleon reaching a maximum of 8.8 million electronvolts (MeV) for nickel 62.
© IN2P3
The average binding energy per nucleon is a measure of the stability of the nucleus. This value is a function both of its size and composition, and is zero for the nucleus of hydrogen, which consists of one solitary proton. The lightest nuclei tend to have the weakest binding energies – with the exception of helium 4 (also known as the alpha particle), whose binding energy of 7 MeV per nucleon is far greater than any of its neighbours deuterium, tritium, helium 3 and lithium. This peculiar stability explains the emission of alpha particles by heavy nuclei.
The binding energy per nucleon begins to increase with the size of the nucleus, reaching a maximum value of 8.8 million electronvolts (MeV) for nickel 62: the most stable of nuclei. It then gradually decreases, reaching 7.6 MeV for uranium.
Other articles on the subject « Radioactive nuclei »
Stability Valley
Beta decay : nuclei getting slimmer to achieve stability The nucleus mass is related to its inter[...]
Nuclear Forces
Three nuclear forces and their hierarchy Three types of force act alongside each other inside a n[...]
Mecanisms of Radioactivity
The way radioactivity works and its origins The impressive range of half-lives that exist, extend[...]
α decay : tunnel effect
Particle and wave: an effect of quantum mechanics The great age of uranium and thorium nuclei tha[...]
Alphas with gammas
Gamma rarely accompanies alpha decays It is surprising that one can hold with hands a sample of p[...]
β decay : weak forces
The forces which allow a nucleus to emit beta electrons Beta decay (β) and electronic capture cha[...]
Weak Forces
A special and fascinating fundamental interaction A third force is at work in the nucleus next to[...]
The Nucleosynthesis
Primordial and stellar nucleosynthesis The Universe hasn’t always existed, It was born a li[...]
Nucleosynthesis (continued)
Mechanisms of atomic nuclei formation Most of the nuclei of atoms that make up our daily life wer[...]