How did the cloud affect France?
The event left a strong impression. A listener of a popular radio station complained that the flowers on her balcony had wilted after the passage of the Chernobyl cloud. If the effects of the cloud’s gamma radiation had been so immediate, it would not have been only the balcony flowers that wilted! The effects of radioactivity take much longer than a single night -years- to appear…
In early May 1986, “the Chernobyl cloud that stopped at our borders” entered history. The reports from the SPCRI – the organization in charge of protection against ionizing radiation – were intended to be reassuring. According to a principle of civil protection, it was important not to unduly alarm the population: “France was affected, but exposure levels remained low everywhere, far below thresholds likely to cause consequences for the population.” Maps produced later would confirm that France was less affected, due to its distance, than other European countries located further east.
In May 1986, the data collected in the field were fragmentary. The Chernobyl cloud arrived unexpectedly, catching specialists off guard. Measurements of ground contamination were indeed carried out by technicians responsible for monitoring fallout from atomic tests in the 1960s or environmental monitoring around nuclear power plants, but these measurements were far from covering the entire territory. Missing details had to be reconstructed.
Two maps were published in 1997 and 2003 by the IRSN (formerly IPSN), the Institute for Radiological Protection and Nuclear Safety. To retrospectively establish a map of radioactive fallout in France, the IPSN based its first map on measurements of food contamination carried out in the two months following the accident. Ground deposits were reconstructed using a model describing the transfer of radioactivity within the food chain.
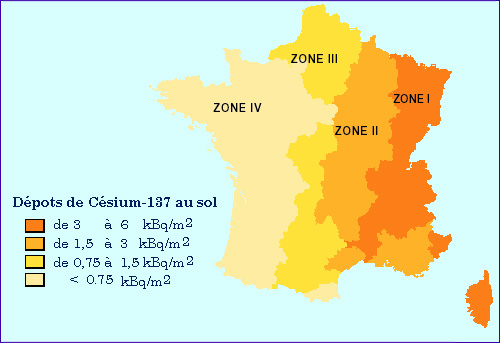
1997 map
This map of radioactive fallout in France, used as a reference until 2003, was produced by the IRSN in 1997 based on measurements of food contamination (milk and leafy vegetables) carried out in the two months following the accident. Ground deposits of cesium-137, a radionuclide representative of the fallout, were reconstructed using a model (ASTRAL software) describing the transfer of radioactivity in the food chain. France appears divided into four zones. The map provides only averages and ignores local peaks of contamination, which can be high.
© IRSN
Since food was the main source of risk, this fallout map was considered a reference until 2003. However, it only provided average contamination levels. It was criticized for lacking detail and, by some, for underestimating the fallout.
To address these criticisms, the IPSN – by then renamed IRSN – proposed a more detailed map in 2003, based on a different model. This model takes into account rainfall in early May 1986, as rain plays a crucial role in bringing radioactivity down to the ground.
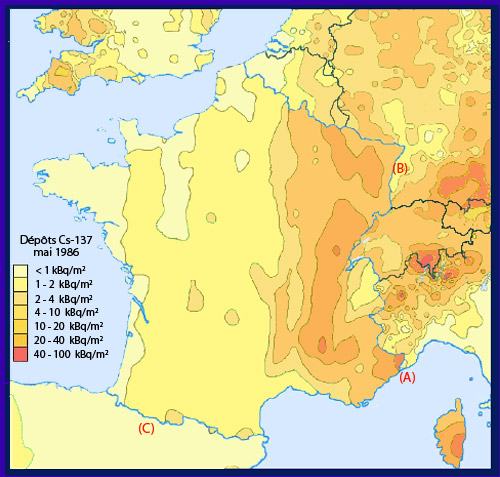
2003 map
This new map produced by the IRSN in 2003 is more detailed. It takes into account rainfall in France at the time the radioactive cloud arrived and is based on an air contamination model. The map does not align well at the borders with the European Community map established from actual measurements. For example, near Ventimiglia (Italy), deposits range from 1–2 kBq/m² on the Italian side to 20–40 on the French side.
© IRSN and Chernobyl Atlas (Source A. Aurengo)
The 2003 map of ground contamination in 1986, based on this model, shows higher levels of radioactive deposits compared to the 1997 map. However, it presents certain shortcomings.
At the borders, values do not match those of neighboring countries. According to the map, the Chernobyl cloud would have gained radioactivity when crossing the border. Finally, the rainwater contamination calculated by the model appears to be overestimated by a factor of 5 to 20 where it can be compared with the few measurements taken at the time near eastern nuclear power plants.
These widely publicized maps, both the old and the new, should be taken with caution. In the case of a phenomenon as complex as Chernobyl fallout, it is uncertain whether the goal of reconstructing a detailed and precise map is achievable.
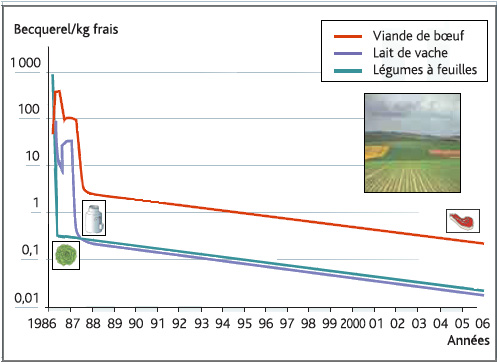
Natural decrease in food contamination
From 1987, one year after Chernobyl, contamination of agricultural products came from root uptake of radioactive cesium present in soils, rather than from deposits on leaves and grass as in the weeks following the accident. As a result, it became much lower and decreased steadily over the years. Today, contamination of agricultural products is 10 to 30 times lower than in 1987, and 1,000 to 10,000 times lower than immediately after the May 1986 fallout.
© Source IRSN
In 1986, doses received by the most exposed populations in eastern France did not exceed 1 mSv (millisievert) per year, i.e. about 40% of natural background radiation.
In 1986, three quarters of contamination came from food contamination, followed by ground deposits. Inhalation accounted for 10%. The passage of the cloud (gamma radiation) was marginal. From 1987 onwards, contamination of the food chain decreased significantly. Twenty years later, annual doses received were 50 to 100 times lower. Radiation from the remaining cesium deposits in the soil had become predominant.
One year after the accident (1987), contamination of agricultural products no longer came from radioactive deposits on leaves and grass. It occurred through root uptake of cesium-134 and cesium-137 present in the soil, a much less efficient process. By 2006, the dose received by the French population due to contamination from the Chernobyl accident was only 0.010 mSv per year, equivalent to just over one day of natural background radiation. Radiation from remaining cesium deposits in the soil having become predominant, contamination from food represented only one sixth of the 0.01 mSv annual dose.
What was the impact of iodine-131 on thyroid cancers in France? In 2000, a study by the IRSN and the French Institute for Public Health Surveillance estimated that between 7 and 55 excess thyroid cancers might occur between 1991 and 2015 among the 2.3 million children under the age of 15 who lived in eastern France in 1986. These figures should be compared with the 899 spontaneous thyroid cancers expected in the same population over the same period. Any excess of 7 to 55 thyroid cancers associated with Chernobyl fallout would be very difficult to demonstrate through epidemiological studies, as the margin of error on the 899 natural cases is around 60.